Sandboxes used to be a place where an agent ran a Python script, opened up a browser to read web pages, and went away. The coding agents our users run today inside sandboxes scaffold a full-stack application, start Postgres next to it, load a few gigabytes of test data, and run an integration suite. The sandbox needs to be close to production for the tests and benchmarks to provide meaningful signals.
We build our sandbox infrastructure on Firecracker, and we built it for performance from the start. This post is about an overlay-based storage engine we built for Firecracker: the design and performance measurements.
Spoiler for the impatient: the copy-on-write subsystem we added made the disk faster, and it turned snapshots into something a running database barely notices.
Firecracker's storage story ends at a raw disk image
Stock Firecracker gives you a raw disk image over virtio-block. It's genuinely fast but is also the entire storage feature set. No copy-on-write, no shared base images, and the only way to snapshot a disk is to keep the whole file.
Duplicating a 100 GB disk image on the NVMe we benchmark below takes 101 seconds, and it produces 100 GB of snapshot. It does not matter if the guest changed one file or rewrote everything, the cost of a snapshot is the whole disk, and the disk has to stay quiesced while you copy it. Snapshotting a Tensorlake sandbox with the same one-file change will cost 167 milliseconds and 105 MB.
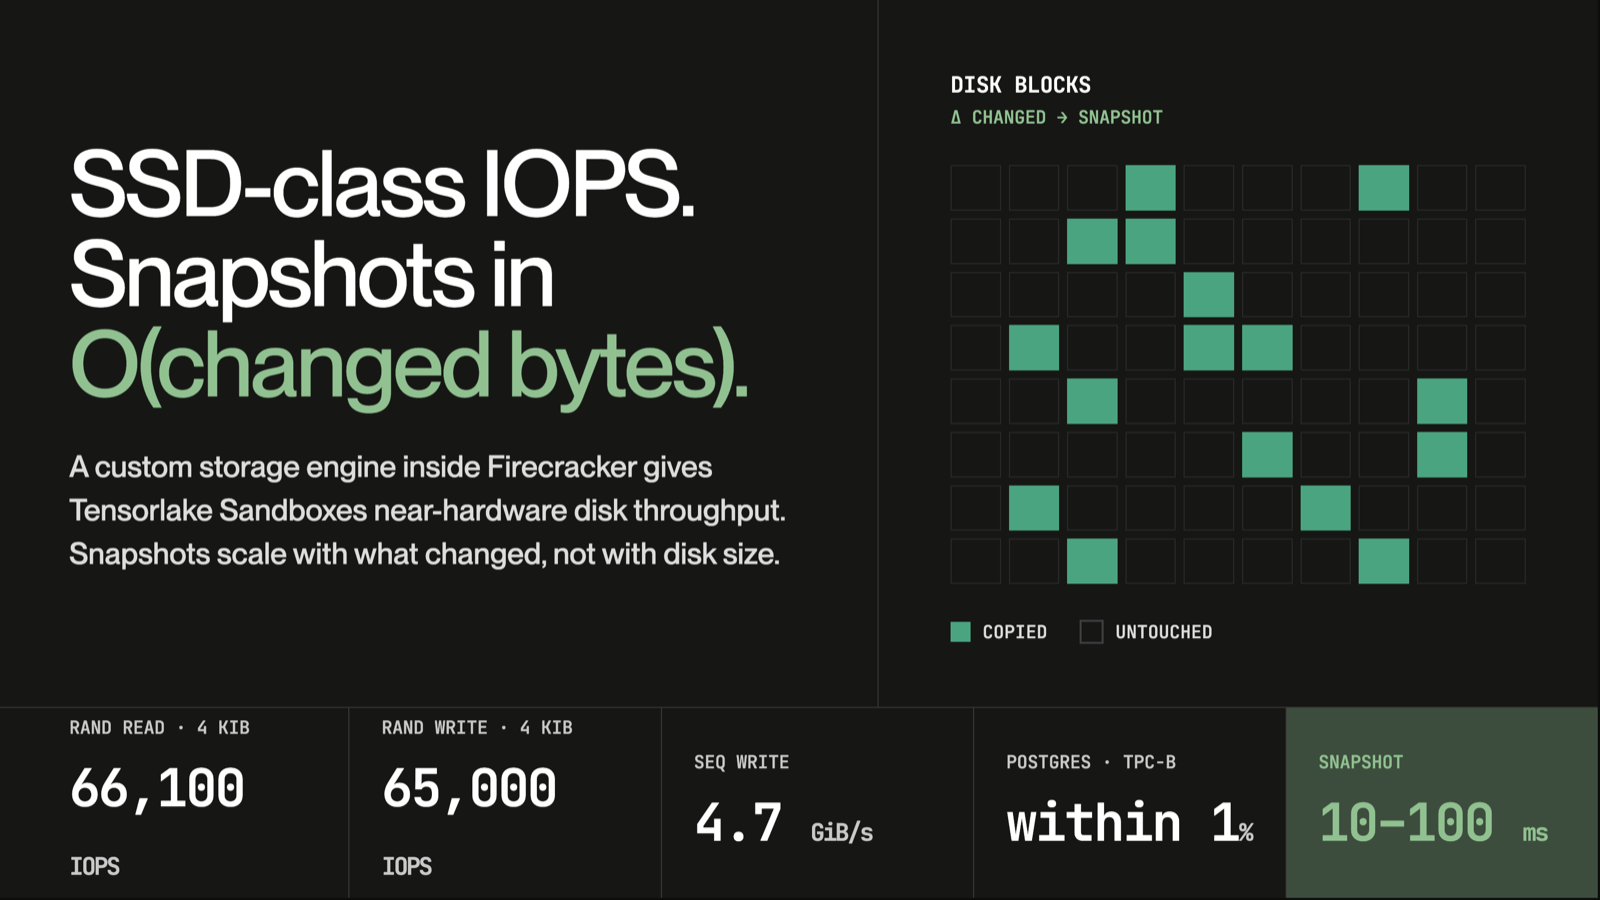
Stock Firecracker keeps no record of which blocks the guest wrote. The disk is one opaque file, so the only safe snapshot is to copy every block, changed or not. Our storage engine sits in the write path and marks each 4 KiB block as the guest dirties it, so at snapshot time it already knows the 105 MB that changed and skips the other 99.9 GB.
The native block overlay
Our fork adds an overlay engine to Firecracker's block device. The guest cannot tell it exists. From inside the VM you see one ordinary virtio-block disk with ext4 on it. No special drivers, no FUSE mounts, no overlayfs. If you ran mount in the guest looking for the trick, you would not find it.
Under the hood, each drive is backed by a read-only base image (the container image, materialized as a flat ext4 block image), a sparse per-VM live overlay file, and optionally a stack of frozen overlay layers from earlier snapshots. The bookkeeping is two bitmaps at 4 KiB granularity: a dirty bitmap that records which blocks live in the overlay, and a zero bitmap that records blocks known to be all zeroes. That is the whole data structure. A read checks the bitmaps and issues exactly one read against the right file. A read of a known-zero block does no I/O at all. Writes land in the live overlay and flip bits. The base is never written, which is what makes it shareable between every sandbox on the host.
If you have ever traced a qcow2 read through its two-level translation tables, this is the part to appreciate: there are no translation trees here and no allocation metadata in the request path. A flat bitmap, then the data.
A few details do most of the performance work:
- The live overlay is mapped into the VMM's address space, so a 4 KiB guest write is a memcpy plus a bitmap update. Not a syscall.
- Flushes coalesce adjacent dirty ranges (we merge across gaps up to 8 KiB) before syncing.
- Base reads go through a small set-associative cache with sequential readahead of 2 to 32 blocks, so a cold walk through the base, think
npm installor a database scan, issues big reads instead of a stream of 4 KiB ones. - There is an io_uring variant of the engine with registered buffers and fixed files. More on that below, because it taught us something.
- Overlay layers pile up as a sandbox ages, so the engine can flatten old ones into each other. The kernel copies the blocks directly between files; the data never passes through the VMM.
What the benchmarks say
We benchmark with fio inside the guest, through the whole stack: ext4, virtio-block, the storage engine, and the NVMe underneath. Every configuration runs the same binary, warmed, five times over; numbers are p50. The exact commands, hardware, and controls are in the appendix.
| workload | stock raw drive, Sync | stock raw drive, Async | native overlay |
|---|---|---|---|
| random read, 4 KiB QD64 | 64,100 IOPS | 62,300 IOPS | 66,100 IOPS |
| random write, 4 KiB QD64 | 62,400 IOPS | 49,300 IOPS | 65,000 IOPS |
| sequential write, 1 MiB | 2.6 GiB/s | 3.1 GiB/s | 4.7 GiB/s |
We expected to pay a small tax for the layering. Instead the overlay beats the raw file it layers over on all three workloads: 3% on random reads, 4% on random writes against stock's better engine, 1.7x on sequential writes. The stock engines pay a syscall (or an io_uring submission) per request against a single fd. The overlay's hot path is a memcpy into a mapping plus coalesced flushes, fewer boundary crossings per request.
Two honest caveats on the sequential number. Both configurations ride host-side writeback, so it measures the virtualization path, not device durability; anything fsync-bound is limited by the NVMe either way. And sequential throughput is the noisiest of the three metrics, with per-run values anywhere from 2.2 to 7.6 GiB/s across configurations.
For reference, the same three commands run directly on the host against the same NVMe, plus an io_uring run to find the device's actual ceiling:
| 4 KiB QD64 | random read | random write | seq write 1 MiB |
|---|---|---|---|
| bare metal, same commands (posixaio, direct) | 12,800 IOPS | 77,100 IOPS | 2.08 GiB/s |
| Tensorlake sandbox, same commands | 66,100 IOPS | 65,000 IOPS | 4.7 GiB/s |
| bare metal device ceiling (io_uring) | 405,000 IOPS | 290,000 IOPS |
The first row is not a typo. The next section explains it.
Why bare metal reads slower than the sandbox
The first row of the bare-metal table shows the identical benchmark running slower on the host than inside the sandbox for reads. Two things stack to cause that, and you will hit both if you rerun fio yourself:
- glibc's POSIX AIO quietly serializes direct I/O to a single fd down to about queue depth 1. Do the arithmetic: 12,800 IOPS times 78 microseconds of flash latency is almost exactly 1.0. Meanwhile the sandbox's reads come from recently written blocks that are warm in host memory.
- The disk itself is much faster than any of these numbers: 405k random-read IOPS when driven with io_uring. The sandbox tops out near 65k because every request crosses virtio and spends guest vCPU time. That limit comes from Firecracker's virtualization path: stock Firecracker stops at the same 65k.
- The device sustains 2.08 GiB/s of sequential writes, which confirms the writeback caveat above: any guest number higher than that is host memory absorbing the write, in every configuration.
Io_uring does not always mean fast
Stock Firecracker's Async engine came in 21% below its own boring Sync engine on 4 KiB random writes, 49,300 versus 62,400 IOPS, while winning on sequential throughput. It held across all five runs, so we had to stop disbelieving it. The explanation is mundane once you see it: when writes land in host page cache, a pwritev is already extremely cheap, and per-request ring submission overhead can cost more than the syscall it was supposed to replace. If your mental model is "io_uring means fast," measure it.
Postgres, because fio is not a workload
fio isolates the block path. A database hits the whole stack at once: random reads, dirty-page writeback, and a WAL commit with a real fsync on every transaction. So we ran pgbench against PostgreSQL 16 inside the guest, fsync on, with a working set deliberately bigger than guest RAM so nothing hides in page cache (setup in the appendix).
| workload | stock Sync | stock Async | overlay Sync | overlay Async |
|---|---|---|---|---|
| TPC-B TPS | 8,917 | 8,558 | 8,749 | 8,828 |
| select-only TPS | 42,863 | 42,664 | 41,946 | 42,733 |
The spread across all four configurations is 4% on TPC-B and 2% on select-only, with the overlay's best engine within 1% of stock's best. Loading the 1.5 GB dataset took 6 to 7 seconds everywhere.
Parity is what an fsync-bound workload should show. A TPC-B transaction commits through a WAL flush, and the device services that flush identically no matter what sits above it, so this test measures the floor of the storage stack. The floor held: copy-on-write layering, delta snapshots, and content addressing cost a database workload nothing measurable.
The payoff: snapshots that cost the change, not the disk
The overlay's bitmaps are also the snapshot mechanism.
To take a snapshot, we pause the VM for a moment, seal the overlay file it has been writing to, and slide a fresh empty one underneath it. The sealed file and its record of which blocks changed are the snapshot. The VM resumes, and the changed blocks upload in the background while the sandbox keeps working.
Snapshots chain into a lineage of frozen layers. Everything is content-addressed, so identical blocks deduplicate across snapshots and images. The layer topology lives in small versioned manifests instead of inside Firecracker's VM state, so cold boot and warm restore share one contract.
We wanted to compare this with other platforms that can persist a sandbox's filesystem, so we picked Modal and E2B and ran the same scenarios against both (comparison setup in the appendix).
Tensorlake and E2B both offer full memory snapshots too, where a restore resumes the VM with its processes still running. This post benchmarks disk snapshots, so the E2B numbers below use its filesystem-only mode wherever the scenario allowed.
Snapshot cost does not grow with data. Ours is flat across an 8x change in state; the spread you see is flush timing, not size. Both of the others climb: E2B from 2.9 to 10.3 seconds, Modal from 17.6 to 64.6.

| data written | Tensorlake freeze | sealed artifact | E2B pause() | Modal snapshot_filesystem() |
|---|---|---|---|---|
| 1 GB | 0.59 s | 1.1 GB | 2.90 s | 17.6 s |
| 2 GB | 1.02 s | 2.2 GB | 3.56 s | 18.0 s |
| 4 GB | 0.16 s | 4.4 GB | 3.82 s | 64.6 s (21.2 s in a prior run) |
| 8 GB | 1.04 s | 8.7 GB | 10.3 s | 62.7 s |
A 100 MB change costs 100 MB. With 4 GB already on the disk, we wrote 100 MB more and snapshotted again on all three platforms:
| second snapshot, +100 MB changed | Tensorlake | E2B | Modal |
|---|---|---|---|
| snapshot time | 167 ms | 0.84 s | 16.6 s |
| artifact | 104.9 MB (25,614 dirty 4 KiB blocks) | not exposed by the API | full filesystem image |
| vs the initial 4 GB snapshot | sized by the delta | 22% of full cost | 78% of full cost |
That 104.9 MB is the 100 MB of data plus filesystem metadata, nothing else. E2B's engine is incremental too, just in seconds rather than milliseconds.
A running database barely notices. We ran pgbench for 5 minutes and snapshotted the drive every 30 seconds, on all three platforms:

| snapshot during live pgbench | Tensorlake | E2B | Modal |
|---|---|---|---|
| steady-state cost per snapshot | 29 to 129 ms | 6.9 to 7.7 s | 9.4 to 13.4 s |
| workload stall per snapshot | same as cost (pause-bounded) | same as cost (workload stalled for the call) | ~2 s zero throughput + 1 s degraded |
| worst observed | 5.6 s (checkpoint backlog, see below) | 7.7 s | worst single second: 12 TPS vs 9,880 baseline |
Our pause flushes unsynced overlay pages, so it tracks the unflushed backlog, not data size. The early snapshots landed on PostgreSQL's first checkpoint and paused for 3 to 6 seconds; once that backlog cleared, every one after cost tens of milliseconds. An fsync-heavy workload keeps the backlog near zero by construction, which makes databases the best case for this design, not the worst.
Every other scenario in this post uses E2B's filesystem-only persistence, the direct parallel to our disk snapshots. This one cannot, because E2B has no way to capture a sandbox's disk while the sandbox keeps running: its filesystem-only mechanism is a suspend, and suspending every 30 seconds would kill the database. Its memory-inclusive snapshot is its only live checkpoint, so that is what we used here. Tensorlake's snapshot is a point-in-time capture taken out from under a running VM, which keeps executing with its processes intact.
E2B documents these snapshots as a brief pause after which the sandbox continues running. What we measured was less brief: each one stalled the workload for about 7 seconds while it persisted the churn since the last, the commit counter going silent for the length of the call. At this cadence that stops the database for roughly a quarter of its life. Resume is clean, though: no degraded tail, unlike Modal's extra second of depressed throughput.
The snapshot is a real crash-consistent point in time, cut to the millisecond. We snapshotted mid-run, 60 seconds into an 8-client pgbench that was writing as fast as it could, then restored the snapshot and asked PostgreSQL to pick up the pieces:
| snapshot under write load, then restore | Tensorlake | E2B | Modal |
|---|---|---|---|
| snapshot operation | 219 ms pause | 1.6 s call, VM paused | 9.6 s call |
| cut point | exact, pause-bounded | exact, pause-bounded | ~1 s into the call |
| committed transactions in the snapshot | all of them (572,727 restored vs ~570,962 committed at freeze) | all of them (240,322 restored) | 28,873 committed during the call are absent |
| PostgreSQL recovery | WAL replay, 2.5 s, clean start | WAL replay, 12.8 s, clean start | recovered, clean start |
| pg_amcheck | clean | clean | clean |
All three snapshots came back as intact databases. The difference is what "the moment of the snapshot" means. Modal's call ran for 9.6 seconds and captured a point about 1 second in, so 28,873 transactions that committed during the call are simply not in the image. E2B's cut is exact and recovered everything; against us it trades a longer pause (1.6 seconds vs 219 milliseconds) and a bigger replay bill (12.8 seconds vs 2.5).
This is the contract databases were engineered against: whatever was committed when the freeze ran is in the snapshot, down to the millisecond.
Provisioning gets the same economics in reverse. Creating a sandbox's disk means creating an empty sparse overlay and pointing the drive at a shared base. No per-VM image copy, base blocks stream in on demand from the content-addressed store, and a sandbox boots before its image has fully arrived on the host.
The same idea extends to memory: the fork adds a snapshot memory export API that freezes a copy-on-write view of guest memory in a parked child process, so snapshot publication reads a consistent image while the VM keeps executing. That one deserves its own post.
The takeaway
Agents test the software they build inside sandboxes, and a sandbox disk that runs at a fraction of native speed quietly changes what those tests mean. Moving copy-on-write layering into Firecracker's block device gave us a disk that measures faster than the raw path it replaces (66,100 IOPS random read, 65,000 random write, 4.7 GiB/s sequential, against 64,100, 62,400, and 2.6 for stock, and within 1% of raw on fsync-bound Postgres TPC-B). And it changed what a snapshot is: a pause measured in tens of milliseconds and an artifact the size of the change, crash-consistent enough that a database restored from one recovers every committed transaction.
The guest just sees a fast disk. The fleet gets an economy the guest never has to know about. That is the whole trick.
Appendix: how we measured
The A/B harness
One binary for every Firecracker configuration, built from our fork on the v1.16.1 base. Our patches leave the plain-drive code path byte-identical to upstream, so attaching the scratch drive with or without an overlay toggles exactly one variable. Host: i5-12600K, Samsung 980 PRO NVMe, Linux 6.8. Guest: 2 vCPUs, 1 GiB RAM, kernel 6.1, Firecracker's own CI ubuntu-24.04 rootfs.
Fio
fio --name=seqwrite  --ioengine=posixaio --rw=write --bs=1m --size=1g \
    --numjobs=1 --runtime=30 --time_based --direct=1 --group_reporting
fio --name=write_iops --size=1g --time_based --runtime=60s --ramp_time=2s \
    --ioengine=posixaio --direct=1 --bs=4K --iodepth=64 --rw=randwrite --group_reporting=1
fio --name=read_iops  --size=1g --time_based --runtime=60s --ramp_time=2s \
    --ioengine=posixaio --direct=1 --bs=4K --iodepth=64 --rw=randread  --group_reporting=1
Each configuration formats the scratch ext4 once, then runs fio five times back-to-back in the same mount, so the numbers are warmed steady state rather than first-touch effects. We report p50 of the five runs. The bare-metal rows ran the identical commands on the host against the same NVMe; the device-ceiling row swapped the ioengine for io_uring at the same queue depth.
Pgbench
PostgreSQL 16 inside the guest, stock configuration, fsync on, data directory on the benchmark drive. pgbench at scale 100 builds a 1.5 GB database, deliberately bigger than the guest's 1 GiB of RAM so the working set cannot hide in guest page cache. TPC-B numbers are the median of three 60-second runs at 8 clients and 2 threads; select-only is one 60-second run. For the live-snapshot timeline we ran pgbench for 5 minutes with a snapshot every 30 seconds and sampled Postgres's commit counter once per second from inside the guest; we sample the counter rather than trust pgbench's own progress reporter, which dies quietly when a VM pause makes the guest clock jump.
The 100 GB copy
The stock-snapshot number in the introduction is measured, not estimated: we wrote a 100 GiB file to the same NVMe at 2.06 GiB/s with fio, then timed cp plus sync end to end. 101 seconds, reading and writing on one device.
The Modal and E2B comparisons
Modal SDK 1.5.2 and E2B SDK 2.32.0, against their production platforms in July 2026, with sandboxes matched to our guest size (2 CPUs, 1 GiB memory) and the same fio, pgbench, and PostgreSQL 16 binaries with identical parameters. Modal snapshots went through snapshot_filesystem() and restored into a fresh sandbox from the returned image. E2B has two mechanisms, and we used the one that fit each scenario: pause(keep_memory=False) suspends the sandbox, persists only its filesystem, and cold-boots it on resume, so it carried the scaling, delta, and crash-consistency tests; create_snapshot() also captures guest memory and spawns new sandboxes that resume with processes intact, so it carried the live-database run, where a filesystem-only pause would have killed the workload. On identical disk state the two modes cost the same within run-to-run variance. A 100 ms heartbeat loop inside the guest measured how long each snapshot froze the workload.
Neither platform's hardware is visible to us, so we lean on how the numbers scale rather than on absolute values. Credit where due: Modal restored in 2.0 seconds and its snapshot survived the mid-write crash test; E2B resumed a fully running VM in 1 to 5 seconds, passed pg_amcheck in both modes, and its delta snapshot of a quiesced disk came in under a second.