


Agentic Table Merging
.webp)
Tensorlake’s Agentic Table Merging: Reconstructing Fragmented Tables for LLM-Ready Documents
TL;DR
- PDFs often split a single logical table across pages or columns, breaking LLM and RAG workflows.
- Tensorlake’s Agentic Table Merging reconstructs these fragments into a single coherent table by reasoning over content and context, not just geometry.
- It handles both cross-page and same-page merges, even with noisy headers, footers, and multi-column layouts.
- Turn it on it with table_merging=True in the SDK or API to get LLM-ready tables out of the box.
If you have ever tried to ask an LLM, “What was the total balance at the end of the year?” on a 200‑page financial PDF, you have probably seen it hallucinate, ignore half the numbers, or give up entirely. A big reason: the table you care about is often split across multiple pages, interrupted by footers, or broken into columns that most parsers treat as separate tables.
Documents, such as PDFs, are designed for printing, not data extraction. When a logical table is fragmented across pages or layouts, traditional parsers tend to output a set of disconnected table fragments. This breaks the semantic integrity of the data and makes it hard or impossible for downstream systems – especially RAG pipelines and LLMs – to answer questions that depend on seeing the whole table at once.
At Tensorlake, we recognized that simple geometric heuristics are not enough. We have developed an Agentic Table Merging workflow that reconstructs fragmented tables into a single, coherent structure, so LLMs can reason over them as if a human had painstakingly stitched the document together by hand.
Instead of just looking at where a table sits on a page, we use a specialized agent to analyze the content and context of table fragments to determine if they are continuations of one another. That includes reading the text between tables, understanding headers and continuation cues, and deciding whether a break is just layout noise or a true boundary.
Our method handles:
- Cross‑page merges: tables that continue across page breaks, often with repeated and noisy headers and footers.
- Same‑page merges: tables that are split into multiple columns or blocks on a single page but logically belong to the same table.
The result is a unified table representation that is much more faithful to how a human reads the document – and far more useful for RAG and analytics.
How the agent works
Before attempting a merge, our system extracts the “context between” tables. The agent sees:
- The end of the previous table.
- The text in the gap (for example, “Page 14 of 92” or “(continued)”).
- The start of the next table.
This lets it:
- Ignore irrelevant footer noise like page numbers or boilerplate disclaimers.
- Recognize meaningful continuation cues like repeated headers or “(continued)” labels.
- Confirm that column structures match (for example, same number of columns, compatible headers).
- Handle tables that appear in different positions on the page (for example, left vs. right column) but still form a single logical sequence.
For tables split on the same page, the agent inspects all tables on the page and reasons about whether one is a continuation of another (for example, an alphabetical list split into two columns).
Why this matters
High‑quality table reconstruction directly improves document intelligence pipelines:
- Better chunks: Merged tables become coherent chunks instead of scattered fragments.
- More accurate retrieval: Queries that depend on specific rows, totals, or column relationships can pull the whole table instead of just one piece.
- Stronger reasoning: LLMs can see the full context – headers, totals, trends – and answer questions like “How did total deposits change year over year?” or “What is the delinquency rate by segment?” without manual stitching.
In practice, this means fewer hallucinations, better numeric reasoning, and a lot less manual cleanup.
Examples
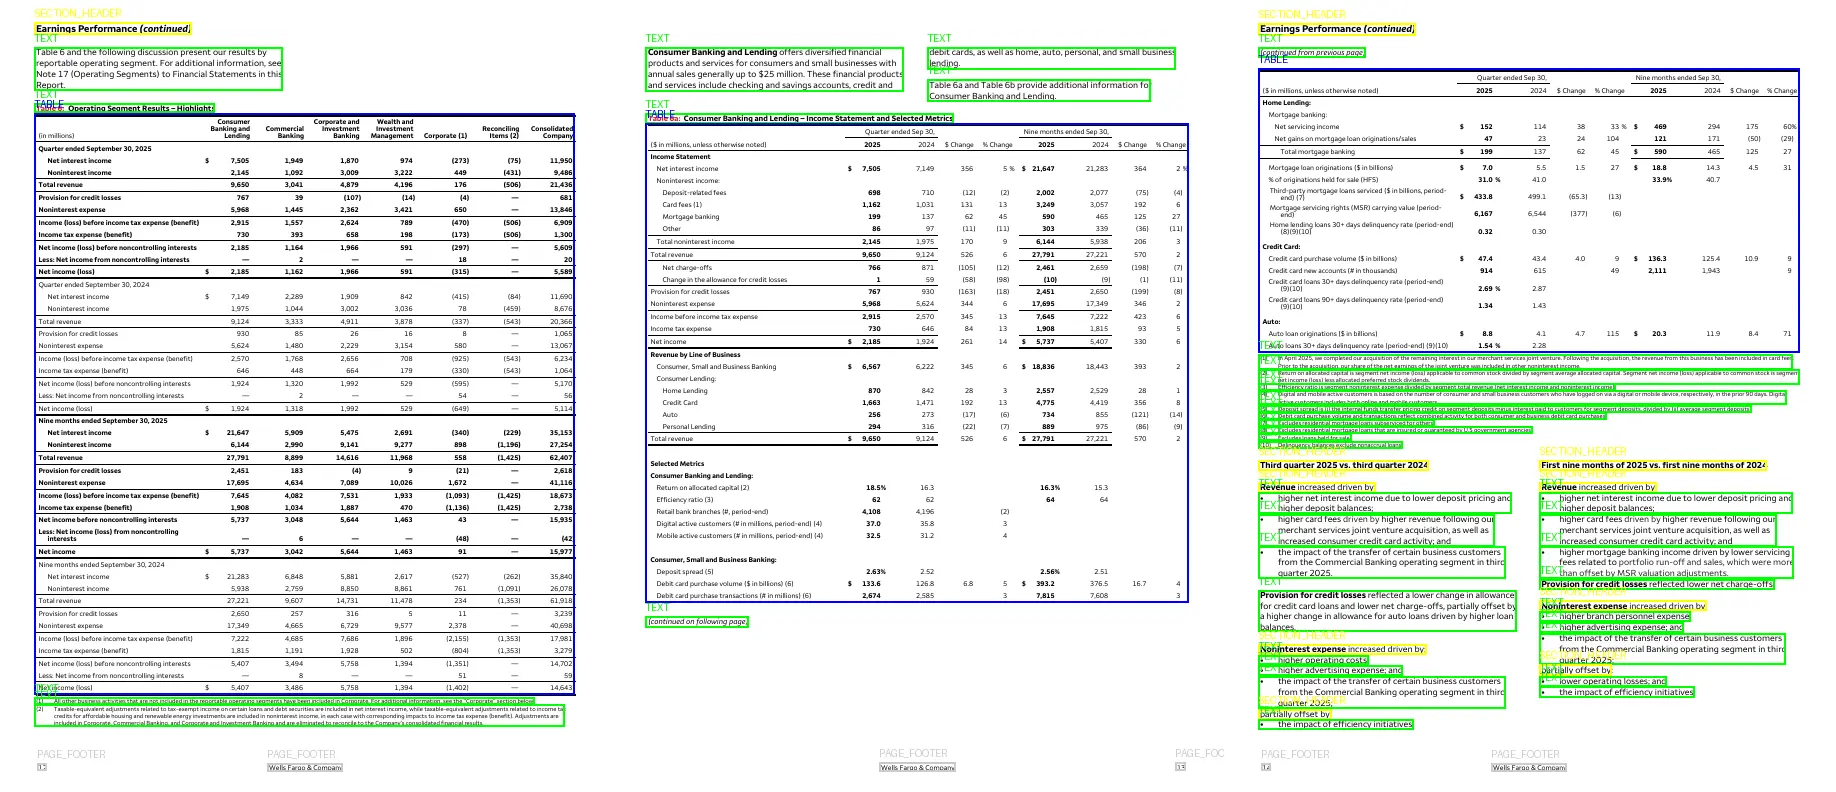
Scenario A: Financial table spanning three pages
Financial tables often contain many metrics across multiple time periods. It is common for these tables to extend beyond a single page. To analyze the content correctly, we need to treat the entire structure as one logical table, not three separate ones.
Our system detects that these three fragments are part of the same table and merges them into a single normalized representation. This allows downstream systems to:
- Compute metrics across all rows and columns (for example, quarterly vs. nine‑month figures).
- Compare periods consistently.
- Answer questions that depend on rows and headers that were originally split across pages.
A truncated view of the merged output looks like this:
"merged_tables": [
  {
    "merged_table_id": "cross_page_merge_1_3",
    "merged_table_html": "<table><thead><tr><th rowspan="2">($ in millions, unless otherwise noted)</th><th colspan="4">Quarter ended Sep 30,</th><th colspan="4">Nine months ended Sep 30,</th><th rowspan="2"></th></tr><tr><th>2025</th><th>2024</th><th>$ Change</th><th>% Change</th><th>2025</th><th>2024</th><th>$ Change</th><th>% Change</th></tr></thead><tbody><tr><td><strong>Income Statement</strong></td><td></td><td></td><td></td><td></td><td></td><td></td><td></td><td></td><td></td></tr><tr><td>Net interest income</td><td>$ 7,505</td><td>7,149</td><td>356</td><td>5%</td><td>$ 21,647</td><td>21,283</td><td>364</td><td>2%</td><td></td></tr><tr><td>Noninterest income:</td><td></td><td></td><td></td><td></td><td></td><td></td><td></td><td></td><td></td></tr><tr><td>Deposit-related fees</td><td>698</td><td>710</td><td>(12)</td><td>(2)</td><td>2,002</td><td>2,077</td><td>(75)</td><td>(4)</td><td></td></tr>
                ...
    <tr><td>Personal Lending</td><td>13,984</td><td>14,413</td><td>(429)</td><td>(3)</td><td></td><td></td><td></td><td></td><td></td></tr><tr><td><strong>Total loans</strong></td><td><strong>$ 327,214</strong></td><td><strong>322,745</strong></td><td><strong>4,469</strong></td><td><strong>1</strong></td><td></td><td></td><td></td><td></td><td></td></tr><tr><td><strong>Total deposits (1)</strong></td><td><strong>782,292</strong></td><td><strong>775,745</strong></td><td><strong>6,547</strong></td><td><strong>1</strong></td><td></td><td></td><td></td><td></td><td></td></tr></tbody></table>",
    "start_page": 1,
    "end_page": 3,
    "pages_merged": 3,
    "merged_at": "2026-01-10T03:12:10.785866+00:00",
    "summary": "The financial results for the quarter and nine months ended September 30, 2025, show strong growth compared to 2024. Net income increased by 14% to $2,185 million for the quarter and 6% to $5,737 million for the nine months. Total revenue rose by 6% for the quarter and 2% for the nine months, driven by increases in both net interest income and noninterest income, particularly from card fees (+13% quarterly) and mortgage banking (+45% quarterly). Provision for credit losses decreased significantly (-18% quarterly, -8% nine months). Revenue growth was notable in Consumer, Small and Business Banking (+6% quarterly) and Credit Card (+13% quarterly). Key metrics show an improved return on allocated capital (18.5% from 16.3% quarterly), increased digital and mobile active customers, and strong growth in credit card new accounts (+49% quarterly) and auto loan originations (+115% quarterly). Delinquency rates for Credit Card and Auto loans improved, while Home Lending's rate slightly increased. Average and period-end total loans and deposits both showed modest increases, with Consumer, Small and Business Banking loans experiencing substantial growth.",
    "merge_actions": {
      "pages": [
        1,
        2,
        3
      ],
      "target_columns": 10
    }
  }
]
For an analyst or an LLM, this merged representation behaves like a single, well‑formed table. That enables end‑to‑end workflows such as:
- “Summarize key drivers of year‑over‑year revenue change.”
- “Compute total deposits growth over the period.”
- “Compare delinquency rates across product lines.”
Scenario B: Same‑page column merges
Tables on the same page are often split into multiple columns to make better use of space. Visually, a human instantly recognizes them as a single continuous table. Most parsers, however, treat them as independent tables.
Our agentic table merging method analyzes the tables on the page and identifies that the table in the right column is a continuation of the one on the left. Both share the same column structure (Security, Shares, Value) and form a continuous alphabetical list of holdings.
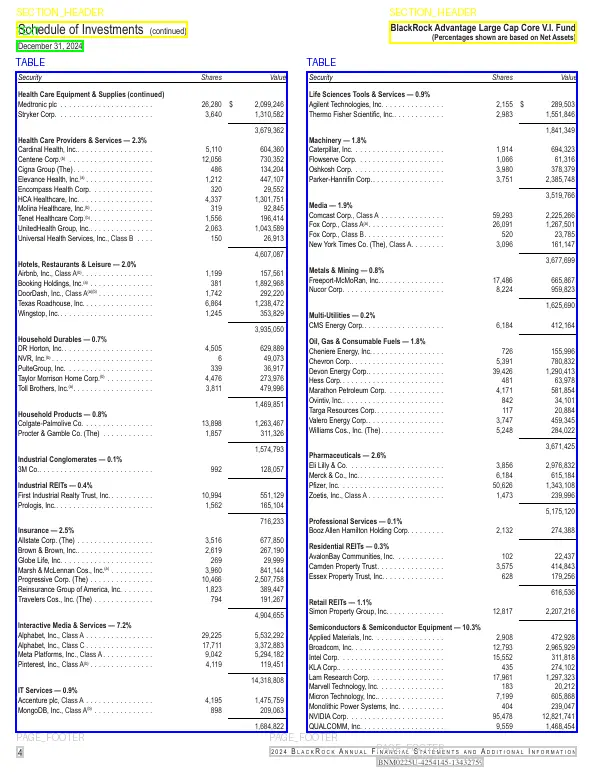
After merging, the resulting table looks like a single continuous structure:
"merged_tables": [
      {
          "merged_table_id": "same_page_merge_2_3",
          "merged_table_html": "<table><thead><tr><th>Security</th><th>Shares</th><th>Value</th></tr></thead><tbody><tr><td colspan="3"><strong>Health Care Equipment & Supplies (continued)</strong></td></tr><tr><td>Medtronic plc</td><td>26,280</td><td>$ 2,099,246</td></tr>

          ...

<tr><td>MongoDB, Inc., Class A<sup>(b)</sup></td><td>898</td><td>209,063</td></tr><tr><td></td><td></td><td>1,684,822</td></tr><tr><td colspan="3"><strong>Life Sciences Tools & Services — 0.9%</strong></td></tr>

          ...

<tr><td>QUALCOMM, Inc.</td><td>9,559</td><td>1,468,454</td></tr></tbody></table>",
          "start_page": 2,
          "end_page": 2,
          "pages_merged": 1,
          "summary": "Both tables share the same column structure (Security, Shares, Value) and represent a continuous alphabetical list of stock holdings by industry sector for the BlackRock Advantage Large Cap Core V.I. Fund. Table 2 continues the list immediately after Table 1's last entry.",
          "merge_actions": {
              "pages": [
                  2
              ],
              "target_columns": null
          }
      }
  ]
For portfolio and risk workflows, this unified representation means:
- Accurate sector and holdings aggregation.
- Reliable exposure calculations.
- Less post‑processing and fewer manual fixes.
SDK Usage
You can enable table merging directly from the Tensorlake Python SDK.
Install or update to the latest version of tensorlake:
pip install --upgrade tensorlakeThen enable table merging in your parse request by setting the table_merging option:
from tensorlake.documentai import DocumentAI
from tensorlake.documentai.models import (
  ParsingOptions,
)

parsing_options = ParsingOptions(
  table_merging=True,
)

doc_ai = DocumentAI(api_key=API_KEY)

parse_id = doc_ai.read(
  file_id="file_XXX",  # Replace with your file ID or URL
  parsing_options=parsing_options,
)
With table_merging=True, any cross‑page or same‑page table fragments that our agent identifies as continuations will be merged into unified tables in the output.
API Usage
You can also enable table merging via the HTTP API by setting the table_merging flag in parsing_options:
// POST /api/v2/parse
{
  "parsing_options": {
      "table_merging": true,
  }
}
Once enabled, your parse results will include:
- Merged table HTML (
merged_table_html). - Metadata such as
start_page,end_page, andpages_merged. - A human‑readable
summaryof the merged table. - Details on the
merge_methodandmerge_actionsthat were applied.
These merged tables can then be fed directly into your RAG pipeline, analytics workflows, or downstream LLM agents.

Related articles

Get server-less runtime for agents and data ingestion

Tensorlake is the Agentic Compute Runtime the durable serverless platform that runs Agents at scale.
“With Tensorlake, we've been able to handle complex document parsing and data formats that many other providers don't support natively, at a throughput that significantly improves our application's UX. Beyond the technology, the team's responsiveness stands out, they quickly iterate on our feedback and continuously expand the model's capabilities.”
"At SIXT, we're building AI-powered experiences for millions of customers while managing the complexity of enterprise-scale data. TensorLake gives us the foundation we need—reliable document ingestion that runs securely in our VPC to power our generative AI initiatives."
“Tensorlake enabled us to avoid building and operating an in-house OCR pipeline by providing a robust, scalable OCR and document ingestion layer with excellent accuracy and feature coverage. Ongoing improvements to the platform, combined with strong technical support, make it a dependable foundation for our scientific document workflows.”
"For BindHQ customers, the integration with Tensorlake represents a shift from manual data handling to intelligent automation, helping insurance businesses operate with greater precision, and responsiveness across a variety of transactions"
“Tensorlake let us ship faster and stay reliable from day one. Complex stateful AI workloads that used to require serious infra engineering are now just long-running functions. As we scale, that means we can stay lean—building product, not managing infrastructure.”
